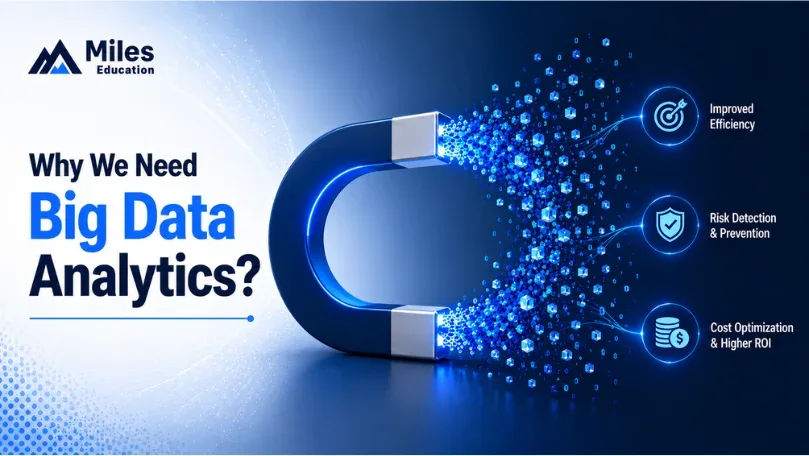
“ Data analytics turns raw data into decisions. Learn what data analytics is, how it differs from data analysis, its importance in 2026, and how to build the skill
Every day in 2026, the world creates roughly 402.74 million terabytes of data. Around 90% of it is unstructured: clicks, chats, call recordings, invoices, sensor pings, scanned PDFs. About 70% of it comes from people, not machines.
Here is the part that should bother every business leader reading this:
Over 97% of businesses have already put money into big data.
Only about 40% of them use analytics well enough to get anything back.
That gap between what companies collect and what companies understand is the entire argument for data analytics.
“Data is the new oil.”
-Clive Humby, mathematician and data science entrepreneur, 2006
Humby’s line gets quoted constantly and misread almost as often. He was not saying data is valuable. He was saying data is worthless until it is refined. Crude oil does not move a car. Crude data does not move a business.
What this guide covers:
What data analytics is, in plain language
The difference between data analytics and data analysis
Why the importance of data analytics jumped sharply in 2026
Where it is used, industry by industry
How to do data analysis, step by step
Which data analytics solutions and tools to know
What a data analyst course should teach you, and who should take one
What Is Data Analytics? An Introduction to Data Analytics
Data analytics is the discipline of turning raw, messy, scattered data into decisions someone can act on.
It covers the whole chain, not one step of it:
Collect the data from apps, systems, sensors, ledgers and third parties
Store it somewhere queryable and governed
Clean it, because raw data is almost never usable as it arrives
Analyse it to find patterns, gaps and outliers
Model it to estimate what happens next
Visualise it so a non-technical person can see the point in ten seconds
Decide, then measure whether the decision worked
“Information is the oil of the 21st century, and analytics is the combustion engine.”
Peter Sondergaard, then SVP and Global Head of Research, Gartner, at Gartner Symposium/ITxpo, 2011
Sondergaard’s metaphor is the most useful introduction to data analytics anyone has written. The fuel is inert. The engine is what converts it into motion.
The four types of data analytics
Type
Question it answers
Example in a finance team
Typical approach
Descriptive
What happened?
Revenue fell 8% in Q2
Dashboards, reports, SQL, Excel
Diagnostic
Why did it happen?
Two enterprise clients churned in April
Drill-downs, cohort analysis, variance analysis
Predictive
What is likely to happen?
12% of receivables will age past 90 days
Regression, forecasting, machine learning
Prescriptive
What should we do about it?
Tighten credit terms on these 40 accounts
Optimisation, simulation, AI agents
Most Indian companies are still stuck at descriptive. The money is in the last two rows.
Set Miles as Your Preferred Source
See our CPA, CMA and AI-in-accounting updates first on Google.
Difference Between Data Analytics and Data Analysis
These two terms get swapped constantly, including by people who should know better. The distinction is simple once you see it.
Data analysis is one step inside data analytics. Every analytics project contains analysis. Not every analysis becomes analytics.
All of the above, plus BI, cloud platforms, ML, AI agents
Owner
Usually one analyst
Usually a team plus a system
In Sondergaard’s terms
A part of the engine
The whole engine
A quick test. If you are asking “what did our Q2 numbers do”, that is data analysis. If you are asking “what should we do in Q3, and can the system flag it before I ask”, that is data analytics.
Why Do We Need Data Analytics? The Importance of Data Analytics in 2026
The case for analytics is not new. What changed in 2026 is the size of the penalty for ignoring it.
1. Data now grows faster than any team can read it.
No human reads 402 million terabytes a day. The choice is not between analytics and careful manual review. It is between analytics and guessing.
2. Decision speed collapsed from months to seconds.
Your competitor approves a loan in three seconds, reprices a product overnight and spots churn before the customer complains. A monthly MIS pack cannot compete with that.
3. Fraud got smarter, so detection had to.
Deloitte projects that generative AI could drive US fraud losses to $40 billion by 2027, up from $12.3 billion in 2023. On the defence side, Mastercard’s payment fraud research found that 42% of card issuers saved more than $5 million in fraud attempts over two years using AI, and 83% of industry leaders reported fewer false positives. Both sides of that fight run on data.
4. AI is only as good as the data underneath it.
This is where most AI programmes quietly fail. Gartner predicts that by 2030, half of all AI agent deployment failures will trace back to weak governance rather than weak models. Bad data does not stay bad quietly. It scales.
5. Employers now test for it.
Gartner expects that by 2027, 75% of hiring processes will include certification or testing for workplace AI proficiency. Analytics fluency has moved from a differentiator to a filter.
6. The job market has already voted.
The World Economic Forum’s Future of Jobs Report 2025 ranks Big Data Specialist as the fastest-growing job in the world, with roughly 110% growth by 2030. AI and big data top the list of fastest-growing skills. And 39% of an average worker’s skills are expected to shift or expire by 2030.
7. India specifically has more demand than people.
NASSCOM estimates demand for data science and AI professionals in India crossing one million by 2026. The supply is not there. That gap is why salaries in analytics keep climbing while other IT tracks flatten.
“In 2026, the boundaries between human, machine, and organizational intelligence will continue to blur.”
-Rita Sallam, Distinguished VP Analyst, Gartner, March 2026
The 2026 numbers, in one place
Figure
What it tells you
402.74 million TB created daily
Manual review is finished as a strategy
$447.68 bn big data analytics market in 2026, heading to $1.18 tn by 2034
Spend is structural, not a fad
12.8% CAGR through 2034
Growth is compounding, not spiking
Big Data Specialist: fastest-growing job, ~110% by 2030
Demand outlives any single tool
39% of worker skills shifting or expiring by 2030
Standing still is a decision
75% of hiring processes to test AI proficiency by 2027
The screen is coming to your CV
Physical AI agents to generate 10x more data than all digital AI apps by 2029
The volume problem is about to get worse
India’s data and AI talent demand crossing 1 million by 2026
The shortage is local, not theoretical
Where Data Analytics Is Used: Industry by Industry
Sector
What analytics does
What it saves or earns
Banking and BFSI
Fraud scoring, credit risk, queue and process optimisation, AML screening
Fewer losses, faster approvals, fewer false alarms on good customers
Healthcare
Diagnosis support, triage, vitals and sensor monitoring, capacity planning
The pattern repeats across every row. Analytics does not replace the expert. It gets the expert to the right 40 cases out of 75,000 alerts.
Data Analytics Solutions and Tools to Know in 2026
You do not need all of these. You need one from each layer.
Layer
What it does
Common data analytics solutions
Spreadsheet + AI assistant
Fast exploration, first-pass summaries
Excel, Microsoft 365 Copilot
Query
Getting the exact rows you need
SQL (non-negotiable), BigQuery, Snowflake
Business intelligence
Dashboards, KPI tracking, exception detection
Power BI, Tableau, Looker
Programming
Cleaning at scale, statistics, modelling
Python (pandas), R
Workflow automation
Routing, approvals, reminders, audit trails
Power Automate
Agentic analytics
Goal-directed analysis with light supervision
Copilot Studio, LLM-based analysis agents
One warning on that last row. Gartner expects that by 2028, 60% of self-service analytics users will use general-purpose LLMs for ad hoc exploration, while production reporting stays in traditional BI platforms. Ad hoc and audited are not the same standard. Know which one you are producing.
What Is a Data Analyst Course, and Who Should Take One?
A data analyst course is structured training that takes you from “I can filter a spreadsheet” to “I can answer a business question with evidence and defend it in a meeting.”
Spreadsheet fluency, including the AI assistants now built into it
One BI tool to publishable standard, usually Power BI or Tableau
Python for cleaning and automation
Statistics you will use: distributions, correlation, A/B testing, cohort analysis
Data storytelling, which is the skill most courses skip and most employers screen for
Governance basics, because DPDP and sector regulators are now part of the job
What to look for before you pay:
Projects you build, not videos you watch
Assessment that is graded, not a completion quiz
A credential the market recognises, tied to a body employers trust
Domain context, so you learn analytics for something rather than in the abstract
“…the ability to understand that data and extract value from it.”
Hal Varian, Chief Economist, Google, on the scarce skill of the data age
Varian said that in 2009. Data got cheaper every year since. His point held: the shortage was never data.
The Highest-Return Place to Learn Analytics: Inside Finance
Most analytics content misses this. The scarce professional is not someone who knows Power BI. It is someone who knows Power BI and knows what a receivable, an accrual and a control weakness are.
Analytics on top of domain judgement is worth several times analytics alone. Which is why the sharpest move for a commerce graduate or a working finance professional is not to abandon accounting for data. It is to stack them.
“Accountants who know how to use AI are replacing those who don’t.”
Varun Jain, CPA, CMA, Harvard Business School alumnus and CEO, Miles Education
That is the thinking behind CAIRA, the Certified AI-Ready Accountant credential, India’s first AI credential built specifically for accounting and finance professionals.
What CAIRA covers:
Three levels, 90 hours, NASBA-approved CPE. Level 1 builds AI and analytics readiness. Level 2 applies it across audit, tax and CFO workflows. Level 3 moves to a firm-wide operating model
Power BI as the analytics layer, taught for finance: KPI tracking, exception detection and dashboards across a full data set rather than a sample
Microsoft 365 Copilot, Power Automate and Copilot Studio, so you can build agents and workflows instead of only reading about them
Miles AI Labs, a safe build environment with no client data and no firm licences needed
Masterclasses led by global instructors, including Data Analytics for Better Decisions, Power BI for Finance, and Investigating Fraud with Data Models
A Credly badge you can show on LinkedIn
CAIRA sits alongside the U.S. CPA and CMA pathways rather than competing with them. If you are weighing the accounting route first, start by checking your CPA eligibility, then layer the analytics on top.
Recall the Gartner prediction from earlier: 75% of hiring processes testing for AI proficiency by 2027. A finance professional who can build a dashboard, explain an exception and defend the number is not competing with AI. They are the person the AI reports to.
FAQs
1. What is data analytics?
Data analytics is the discipline of collecting, cleaning, analysing and modelling data to support decisions. It spans the full chain from raw data to a recommendation someone acts on.
2. What is the difference between data analytics and data analysis?
Data analysis is a step inside data analytics. Analysis examines a prepared dataset to explain what happened. Analytics covers the whole system, including collection, storage, prediction, visualisation and the decision itself.
3. Why is data analytics important in 2026?
Because roughly 402.74 million terabytes are created daily, decision cycles have collapsed to seconds, AI systems fail when the data underneath them is poor, and Gartner expects 75% of hiring processes to test AI proficiency by 2027.
4. How do I start learning how to do data analysis?
Start with SQL and a spreadsheet, add one BI tool such as Power BI, then Python for cleaning. Build two projects end to end. Portfolio evidence beats certificates alone.
5. What is a data analyst course, and is it worth it?
It is structured training covering SQL, BI, Python, statistics and data storytelling. It is worth it when it is project-graded and tied to a credential employers recognise. It is not worth it when it is a video library with a completion certificate.
6. Do accountants need data analytics?
Increasingly, yes. Audit, tax, controllership and FP&A have all shifted from sampling toward full-population testing and exception-driven review. Both run on analytics.
Uttam Pai Umesh
US CPA- Accounting & Finance Expert
Uttam is a finance professional with over seven years of experience across accounting, auditing, and finance, now teaching at the point where those disciplines meet AI. He teaches accountants how to put AI tools to work in the tasks they already do, and builds learner-focused content that turns complex concepts into steps a student can apply the same week, helping professionals move ahead in their careers with confidence.