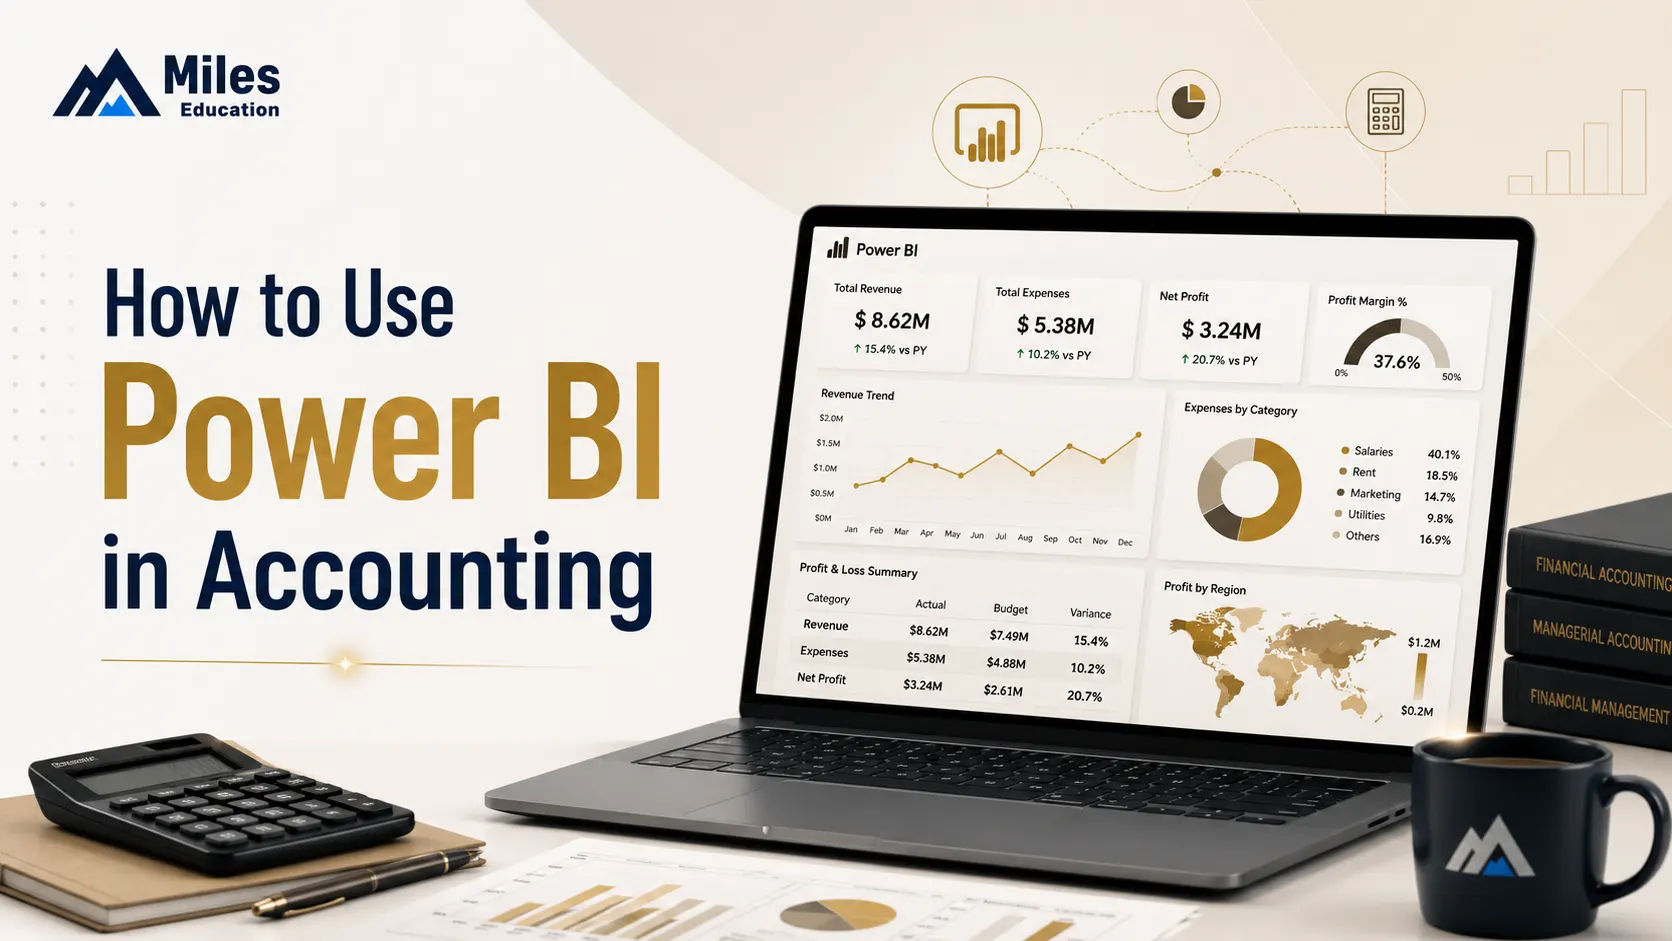
Why Power BI Is Used in Accounting
So, why is Power BI used so heavily by finance teams - and is Power BI used in finance at scale? The numbers speak clearly:
Power BI holds roughly 30% of the global BI market, making it the leading analytics platform worldwide
Microsoft reports 30+ million monthly active users across 375,000+ organizations, including 97% of the Fortune 500
The BFSI (banking, financial services, insurance) sector is the single largest adopter of BI tools, accounting for about a quarter of total BI revenue
Self-service reporting in Power BI saves users over 2 hours a week, and automation makes report production about 2.5x faster
For accountants specifically, Power BI and accounting work together because the tool solves four chronic pain points:
Manual consolidation - Power BI pulls data automatically from Tally, QuickBooks, Xero, SAP, Oracle, and Excel, ending copy-paste month-ends
Static reporting - Instead of a frozen PDF, stakeholders get dashboards they can filter by entity, period, cost center, or client
Error risk - One governed data model means one version of the truth across the finance function
Slow close cycles - Refreshable reports shrink reporting timelines from days to minutes
Power BI for Accounting Reporting: What You Can Build
Power BI for accounting reporting typically covers these report families:
Power BI Accounting Report | Key Visuals | Business Question Answered |
|---|
Profit & Loss dashboard | Matrix with drill-down, variance bars | Where are we vs budget, by month and department? |
Balance sheet snapshot | KPI cards, trend lines | How healthy is our financial position? |
Cash flow analysis | Waterfall charts | Where did cash actually go this quarter? |
Accounts receivable ageing | Ageing buckets, DSO gauges | Which customers are slipping past 60/90 days? |
Accounts payable tracker | Due-date timelines | What must we pay this week to avoid penalties? |
Audit and anomaly reports | Scatter plots, outlier flags | Which journal entries look unusual? |
A common early hurdle is the Power BI accounting format - displaying negatives in parentheses, indenting sub-accounts, and ordering a P&L the way accountants expect. Three tips:
Use custom format strings like #,##0;(#,##0) for parenthesized negatives
Build a dedicated chart-of-accounts table with sort-order columns so line items appear in statement order, not alphabetically
Use the matrix visual with "+/-" drill-down to mimic expandable financial statements
How to Use Power BI in Accounting: A 6-Step Workflow
Connect - In Microsoft Power BI Desktop, use Get Data to link your ERP, accounting software, database, or Excel trial balances
Clean - Use Power Query to remove blank rows, fix data types, and standardize account names
Model - Relate your GL transactions to a date table and chart-of-accounts table (a "star schema")
Calculate - Write DAX measures for totals, YTD figures, variances, and ratios like current ratio or gross margin
Visualize - Build the dashboards from the table above, applying proper accounting formats
Publish & refresh - Push to Power BI Online, set scheduled refresh, and share securely with row-level security for client or entity confidentiality
Is Power BI in Demand? Careers and Salaries
If you are wondering "is Power BI in demand?" - emphatically, yes. Power BI developer jobs and analytics-enabled finance roles are among the fastest-growing postings on hiring platforms, and BI skills now appear in a large share of accounting and FP&A job descriptions. Employers increasingly treat Power BI the way they treated Excel a decade ago: not a bonus skill, but a baseline.
Roles where Power BI skills command a premium include:
Financial analyst / FP&A analyst
Management accountant and controller roles
Audit and forensic accounting (anomaly detection)
Power BI developer and BI consultant positions in finance domains
Nadella himself described how the tool is "changing conversations inside of Microsoft" - and that is precisely what it does inside finance teams: it moves the discussion from compiling numbers to interpreting them.
How to Learn: Power BI for Accountants Training
There are plenty of ways to start, including a Power BI course free of cost - Microsoft Learn offers free learning paths, and Power BI Desktop itself is a free download, so you can practice on your own trial balances today.
But generic tutorials teach you the tool, not the profession. Power BI for accountants training works best when it is taught in an accounting context - building actual P&Ls, ageing reports, and variance dashboards rather than sales demos.
That is the philosophy behind Miles Education, one of the leading institutions preparing accounting and finance professionals for globally recognized credentials like the US CPA and CMA, with a strong focus on making accountants future-ready rather than just exam-ready. Recognizing that the next decade of accounting belongs to professionals who pair domain expertise with analytics and AI, Miles has also launched CAIRA - an initiative focused on AI-readiness for accountants, blending accounting fundamentals with the data, automation, and BI capabilities (including tools like Power BI) that modern finance employers now expect by default.
The Bottom Line
Power BI for accounting is no longer optional tech literacy - it is the connective tissue between raw financial data and confident business decisions. Start small: download Microsoft Power BI Desktop, rebuild one monthly report as a dashboard, and publish it to Power BI Online. Within a quarter, you will wonder how your month-end ever worked without it.
The accountants who thrive next are not the ones who resist automation - they are the ones who build the dashboards everyone else depends on.
FAQs
1. What is Power BI in accounting?
It is the use of Microsoft's BI platform to automate, visualize, and analyze financial data - from P&L dashboards to AR ageing and audit analytics.
2. Is Power BI used in finance?
Yes. The financial services sector is the largest adopter of BI tools, and Power BI leads the market with roughly a 30% share.
3. Can I learn Power BI for free?
Yes - Power BI Desktop is free, and Microsoft Learn offers free structured courses to get started.